
Transforming agriculture through satellite imagery
By Werner Coetzee, Head of Yield: PICKLOGGER™, IFLY™, PPM™
In the ever-evolving agriculture landscape, the emergence of satellite im- agery has sparked a transformative revolution for producers worldwide. One such ground-breaking service, IFLY VERDE™ by Airbus, is reshaping the way we perceive and manage crop cultivation.
Unveiling IFLY VERDE™
A bird’s-eye perspective into crop analytics
Launched in 2019, IFLY VERDE™ is far more than just a service. It is a true game changer that delivers detailed crop analytics through precise satellite imagery. Think of it as a finely tuned lens capturing fields with accuracy and clarity, while removing the pesky clouds that often obscure the intended view.
Why should producers embrace IFLY VERDE™?
- High-frequency insights
Get real-time updates on crop perfor- mance, transforming raw data into action- able insights for timely decision-making.
- Scouting and historic trending
Utilise IFLY VERDE™ not only for in-season monitoring but also as a scouting tool with access to historic data dating back as far as 2014. It is a journey through time, allowing producers to understand their fields’ performance evolution.
- Scalability for large farms
Scale up your analyses effortlessly. IFLY VERDE™ is designed to also be used for large farms and fields, ensuring comprehensive coverage for efficient decision-making.
- Calibrated crops
Benefit from calibrated crop data featuring specific parameters (fCover, LAI and Chloro- phyll). This is not just data but rather a tailored approach to understanding the nuances of crop health.
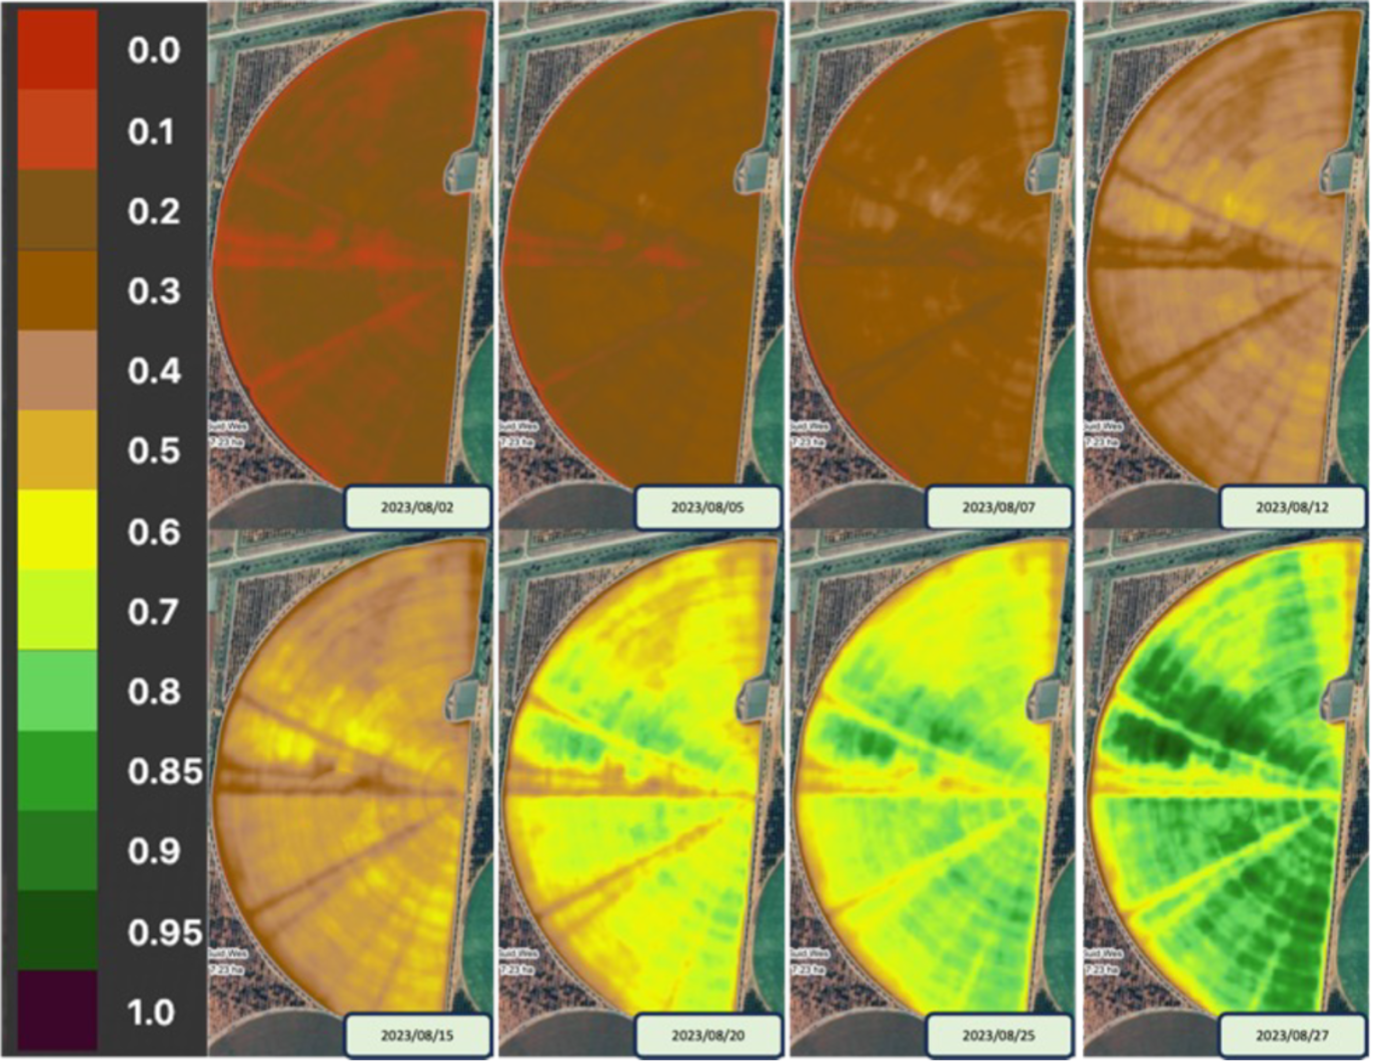
Figure 1: fCover imagery where 8 images are displayed.
What does IFLY VERDE™ measure?
Using biophysical parameter methodology, IFLY VERDE™ currently measures the following three parameters: 1. fCover (Fraction Green Vegetation Cover index), 2. LAI (Leaf Area Index) and 3. CHL (Chlorophyll).
- fCover – Figure 1
- The % of plant material that covers the soil
- Provides an early-season indication of the rate of crop development and
- Minimum of 3 images a In the example provided, 8 images can be seen.
- LAI – Figure 2
- The ratio of green leaves present per unit ground area (m2 : m2).
- Characterises the plant-canopy structure and gives an idea of the amount of biomass available in a Measures crop growth and productivity.
- Fields should ideally exhibit uniformity throughout the season, but variations may arise due to soil irregularities, pests, diseases, or weed presence.
- CHL – Figure 3 (next page)
- Chlorophyll A & B content per unit of
- Values typically range between 20 and
80 µg/cm2.
- Chlorophyll A/B variations indicate ageing, stress, or damage to the photosynthetic apparatus, reflecting both biotic and abiotic factors like drought, sunlight exposure and pigment-inhibiting diseases that could impact crop
- There is a strong correlation between chlorophyll content and nitrogen levels.
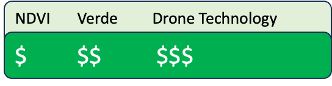
IFLY VERDE™ offers a relatively inexpensive, yet more advanced than NDVI, remote sensing technology (drone technology) for measuring vegetation biomass and more.
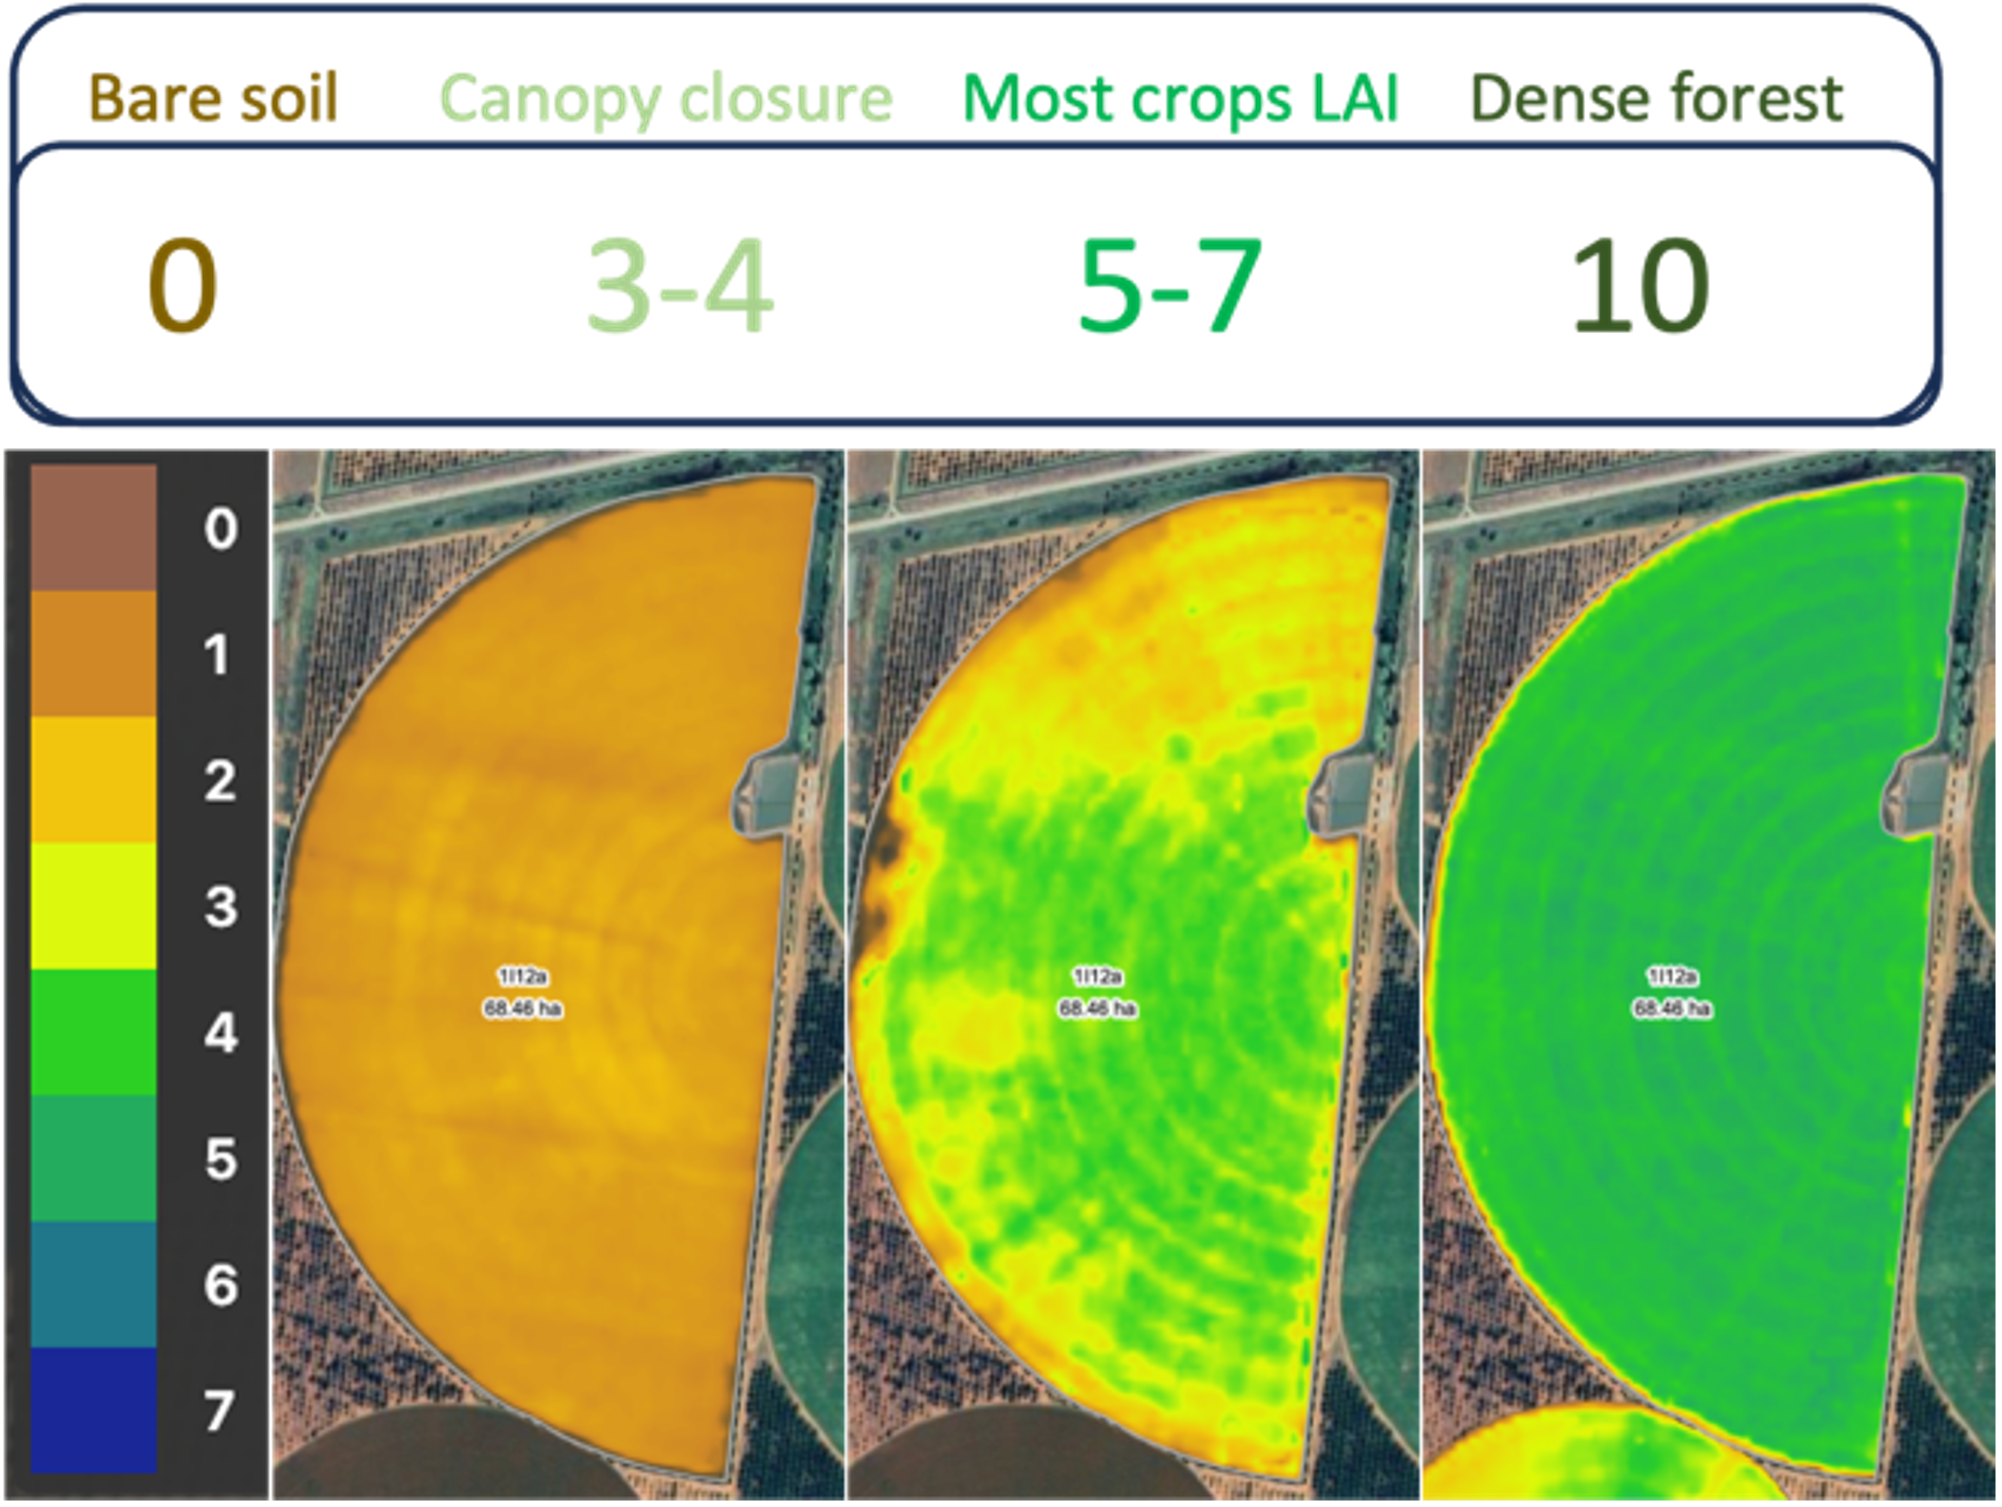
Figure 2: An example of LAI imagery.
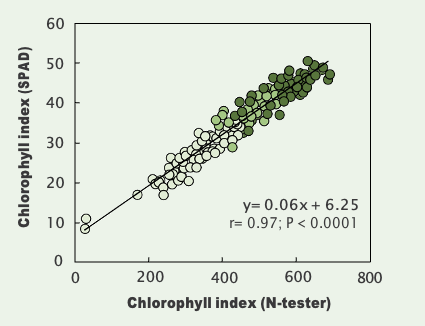
Figure 3: Correlation between chlorophyll and nitrogen indicated on a graph. Thibaut Verdenal, Vivian Zufferey, Jean-Sébastien Reynard, Jean-Laurent Spring (2023).
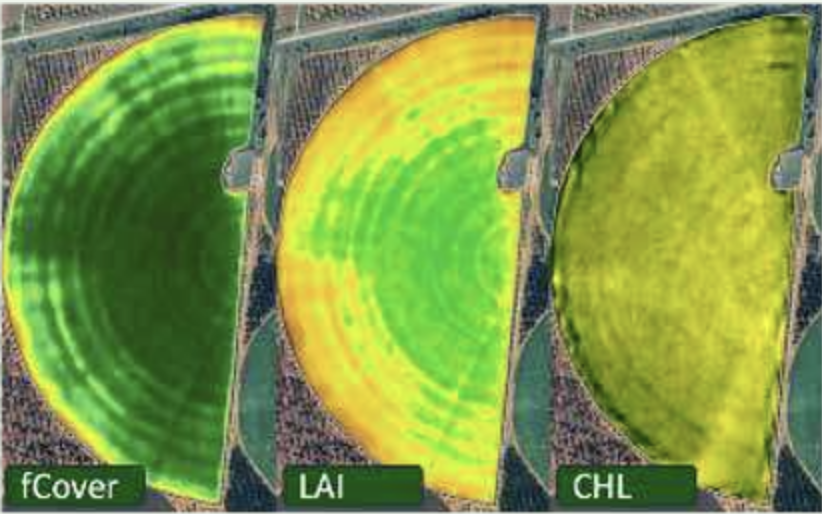
Figure 4: fCover, LAI and chlorophyll parameters combined, displayed using satellite imagery.
In conclusion
As the journey through fCover, LAI and CHL brings an understanding of the benefits of each, envision the power these indices bring to producers’ fingertips – a dynamic story told through each leaf and every shade of green.
In the evolving narrative of agriculture, these indices stand as protagonists, guiding producers toward informed decisions and promising a future where technology and nature combine for a flourishing harvest.


