Optimise table grape production with PICKLOGGER™
by Werner Coetzee: Commercial Head: PICKLOGGER™, Jan-Willem Boonzaaier: Commercial Head: Services and Gerrie van Deventer: Horticulturist
The future of table grape production lies in precision farming, where data-driven decisions can significantly improve yield and profitability.
PICKLOGGER™ is but one of the innovative tools leading the precision charge. This innovative device, which is attached to harvesting shears, registers a GPS point every time a bunch of grapes is picked. At the end of the harvest day, producers are able to observe the bunch distribution across the orchard and accurately identify the yield variation within each block – something that has not been possible before. With this technology, table grape producers can apply precision farming in blocks by adjusting inputs and management practices to successfully address areas of lower production.
Table grape producers already using PICKLOGGER™ for optimal block management with great success are enjoying the benefits flowing from the practical application of the technology, a few of which are discussed as examples in this article.
Economic challenge of table grape production
To farm profitably, table grape producers are constantly faced with the challenge of yield optimisation versus input costs. A block that is able, for example, to produce 4 500 cartons per ha on average, is regarded as relatively profitable, and as long as it remains profitable in terms of this average, few questions will be asked and little consideration will be given to potential improvements.
But what if producers want to address blocks that underperform, or have identified blocks for production optimisation through the application of precision farming? The mere consideration of the average yield of the block is no longer sufficient to provide answers.
PICKLOGGER™ offers a solution to accurately identify different performance levels within an orchard or block. The evident difference between these two approaches (average performance vs specific spatial performance levels) is illustrated with reference to an example (Figures 1 and 2).
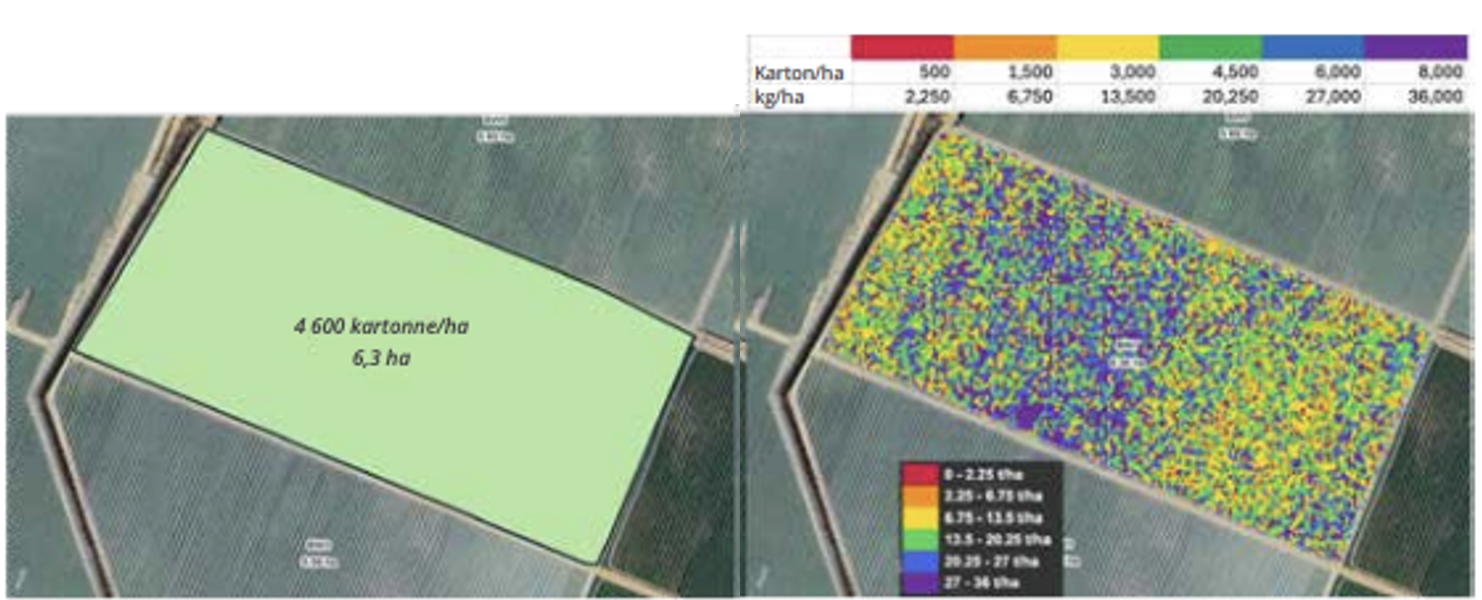
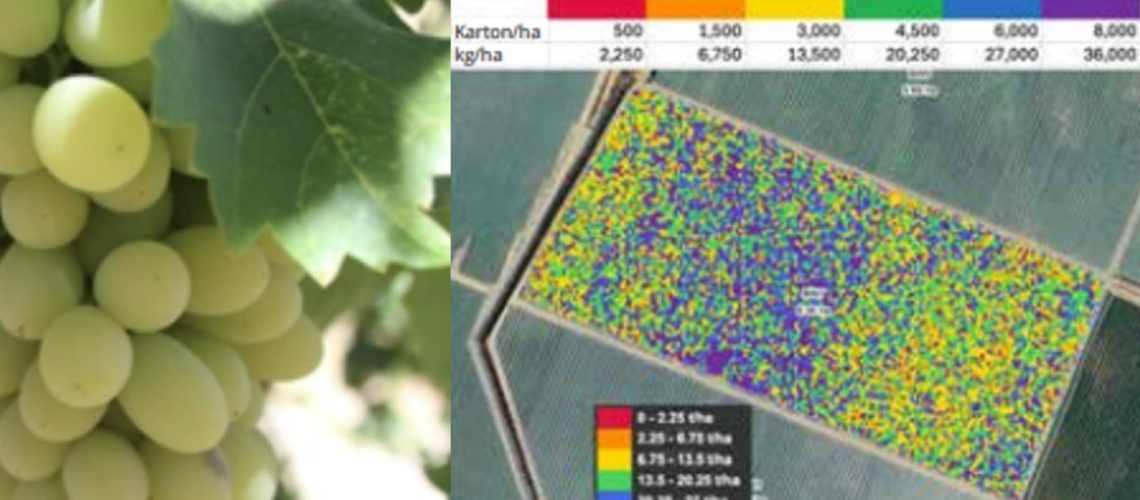
The example involves a 6,3 ha block of table grapes in the Breede River Valley in South Africa that produced an average harvest of 4 600 cartons per ha (Figure 1). The yield map for the same block generated with the assistance of PICKLOGGER™ (Figure 2), shows the yield variation within the block where certain areas clearly performed better than others.
By looking at the yield distribution map, areas delivering excellent yields can easily be distinguished from the areas producing weaker yields. Certain areas yield much more than the average of 4 600 cartons per ha, while almost 30% of the block yields less than 3 000 cartons per ha. Furthermore, more than 40% of the block produces the equivalent of more than 6 000 cartons per ha. This puts the performance and potential of the block in a completely different perspective, compared to looking only at the average yield for the entire block.
This significant distinction highlights the importance of firstly being able to identify low-yield areas within a block and then, secondly, to address them suitably. The precision farmer seeking optimal yields and profitability would want to determine the possible actions required to address the underperforming portions of the block, thereby improving the block’s overall profitability. In our example above, an improvement of a mere 20% of only those areas that produce 3 000 cartons per ha, would already result in an extra 1 000 cartons for the block.
PICKLOGGER™ data indicating the various production levels throughout an orchard can also be used to provide valuable insights into the different actions, manipulations and management practices that can be applied.

Average yield (Figure 1 left) vs. accurate identification of yield levels (Figure 2 right). Figures 1 and 2: Average yield per block versus identifying different levels of performance within the same block.
Data mining for better decision making
Through the MYDATA MINING™ process, PICKLOGGER™ yield maps can be evaluated against other precision data of the same area such as soil classification, soil chemistry, leaf analyses, carbohydrate analyses, soil health and pest and disease pressure.
The end result is a thorough analysis and identification of the potential causes of underperformance, which information can be used for the planning of corrective actions and strategies for the upcoming season.
Moving to a homogeneous orchard
Establishing a more homogeneous-producing orchard is essential for consistent and predictable yields. Although certain experts in the field maintain that the careful manipulation of an orchard can lead to predictable outcomes/yields, it still remains a major challenge (almost impossible) to guarantee 100% accuracy using this method.
Since the introduction of PICKLOGGER™, producers using the yield map data are astonished when, for the first time, they can observe how yield distribution varies within a block. PICKLOGGER™ therefore bridges the gap between predicted yields and actual yields by providing real and accurate data that reflects the true condition of the orchard, which then allows for continuous adjustments and improvements.

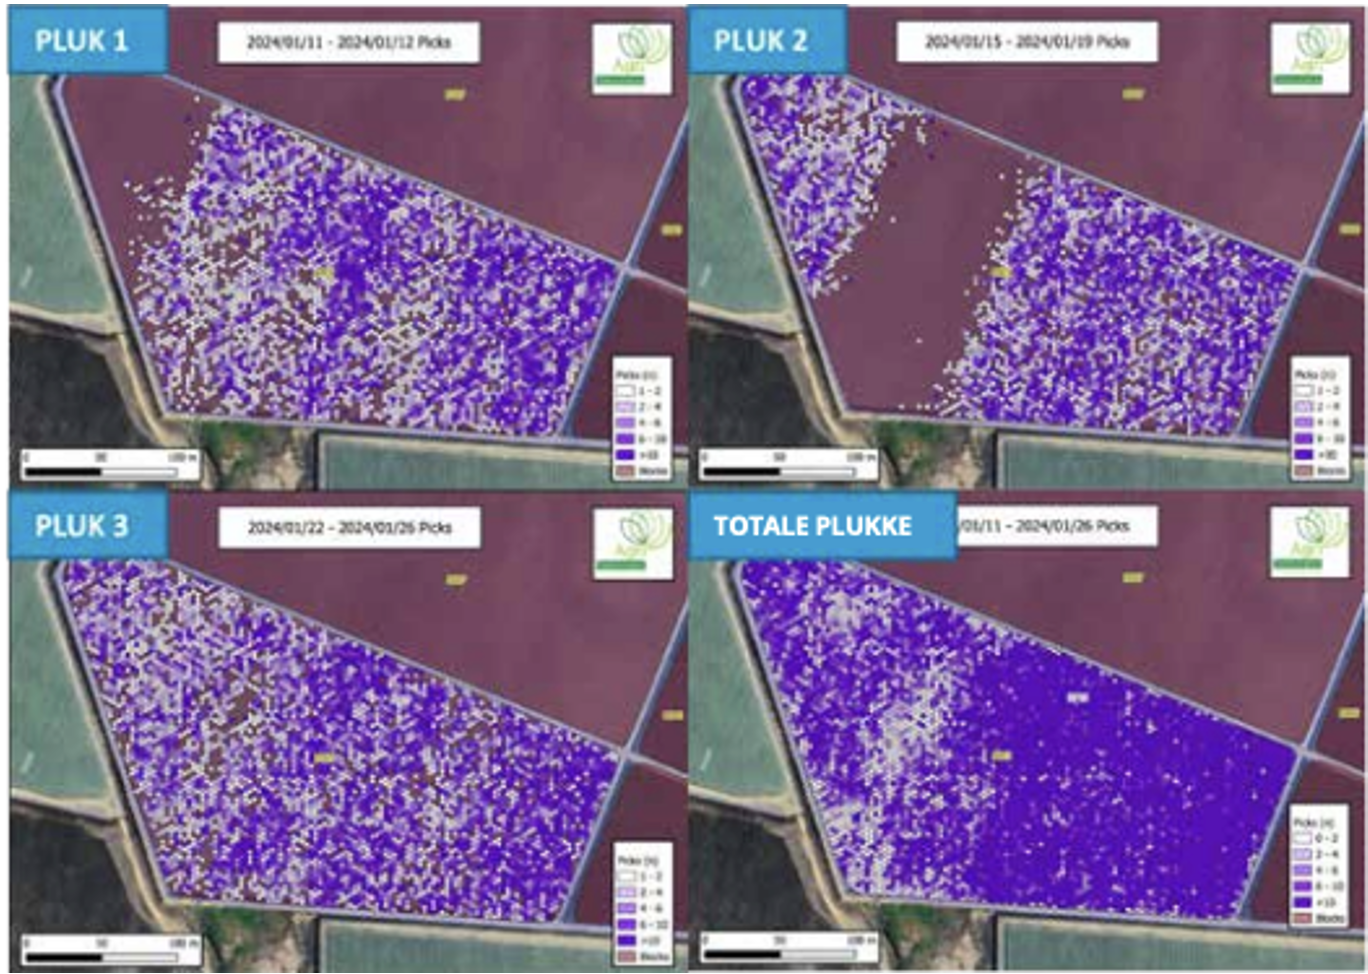
Figure 3: PICKLOGGER™ data depicting Picks 1, 2, and 3, as well as all 3 picks combined on maps.
Management tool
A further application of PICKLOGGER™ available to table grape producers, is keeping track of the number, as well as the point in time (date) of harvests throughout the block, and the evaluation/interpretation of this data.
The example above of a table grape producer in the Western Cape, South Africa (Figure 3), shows three different rounds of picking on the Sweet Celebration cultivar, as well as the map showing the total harvests (three rounds combined).
By looking at the maps, it is possible to identify the areas of the block that were ready for harvest earlier (Pick 1) than other areas. The different rounds of harvests taking place are indicated on the maps of Pick 2 and Pick 3 using colour. The map bottom right shows the distribution of the number of bunches picked per m² (white < 2 and purple > 10).
The maps showing the individual picks, combined with the map indicating total picks, provide further insights in terms of the overall most underperforming area. In this particular case, the underperformance was due to poor drainage, which has now been addressed in preparation for the next season.
Even though the impact of the drainage problem (underperformance) had already been observed in the orchard and was known to the producer, with the help of PICKLOGGER™ data the relative loss of income in terms of cartons/ha could be accurately quantified. Furthermore, the potential benefit in addressing the problem can be now be considered against the relative performance of the rest of the block. The quantification of the adverse impact on production in this area was self-evident of the requirement to invest capital that would address the problem.
This data can now be used for purposes of planning and comparison for the next season. By collecting accurate data on earlier- and later harvest areas in a block and/or farm and identifying trends from this data, the most suitable management practices can be decided on and applied.
In conclusion
In the competitive world of table grape production, the use of innovative technologies such as PICKLOGGER™ is what positions producers ahead of the “bunch”. By identifying and correctly addressing low-yielding areas, producers can improve their profitability by taking effective actions to optimise their inputs, reducing costs and, in the long run, achieving more consistent yields.
The examples above are just a few cases to illustrate the power and potential of PICKLOGGER™ data. The potential it offers for better decision-making and management, however, holds even more value. The data unlocked by PICKLOGGER™ will make it possible for the producer focused on precision farming and improving profitably and sustainability, to unlock even more opportunities.
The technology and use of PICKLOGGER™ does not require any special actions or changes to practices – it simply adds further value by adding to an existing practice – the harvesting of fruit/vegetable crops.
PICKLOGGER™ is the final piece of the puzzle for precision farming practices in permanent crops and forms an integral part of decision-making to farm more profitably. The implementation and use of PICKLOGGER™ has opened up a whole new world of data to precision farming. The investment in PICKLOGGER™ is not only about technology; it is about the transformation of the approach to table grape production. With precision data at the producer’s disposal, informed decisions can be made that will drive success and sustainability in the orchard.


