Marnus Ferreira: Head Soil Scientist
The application of variable-rate soil amendments such as lime or gypsum, is nothing new in the agricultural industry and the related benefits in terms of cost savings and soil fertility are widely recognised. Many producers, however still do not make full use of their variable rate systems during fertiliser applications and planting (or sowing). This remains the case, despite the even larger benefits that could be achieved.
Why the resistance?
There are many reasons for the non-use of these systems that could, to an extent, be understood. Firstly, the technology is intimidating and relatively unknown (or insufficiently supported and explained by dealers). Secondly, with the use of this technology the fear of change raises its head, which often leads to a reluctance to implement. Eventual change happens very slowly due to the relative success achieved through the use of historical methods. The primary reason for the apparent resistance is the uncertainty regarding what variable rate maps should be based on. Harvester yield map data is used most often, but the question to be asked is whether this data does in fact generate the best results. Often, data obtained through the performance of an accurate soil classification service has the strongest correlation with yield. The soil’s physical (and chemical) characteristics hold the key as to why (assuming fertilisation and soil fertility are in place) certain areas perform better than others.
Soil classification data holds the key
The significance of soil classification data with reference to yield achieved has been noted worldwide, based on millions of hectares of yield data that have been analysed and compared to soil data. The physical properties of soil must be managed and improved where possible (such as compaction and drainage etc.) but can, in general, not be altered significantly. The soil classification map, therefore, remains one of the most important base maps for variable rate fertilisation and seeding.
Determine the physical impediments in the soil
As stated, certain soil physical characteristics can be improved or ameliorated, while others cannot. To determine the characteristics, and therefore, whether they could be improved or not, it is necessary to perform an in-depth soil classification and obtain recommendations based on scientific knowledge and experience. If the soil classification reveals a physical impediment that cannot be improved, the soil has an intrinsic upper limit to its production potential. This impediment could be managed by applying variable rate top dressing, for example. However, even with optimal precipitation, the impediment will always be limiting in terms of yield and production. On the other hand, some areas may be found to have physical properties that can be improved through practices/interventions such as cultivation, drainage, soil amendments, etc. As costly as some of these practices may be, a simple return on investment (ROI) calculation can be done to weigh up the cost of implementation versus the improvement in yield.
Often, it takes only one season to pay back the costs, with change, for the implementation of a strategy that has a multi-year ROI.
Data analysis: How is the data used?
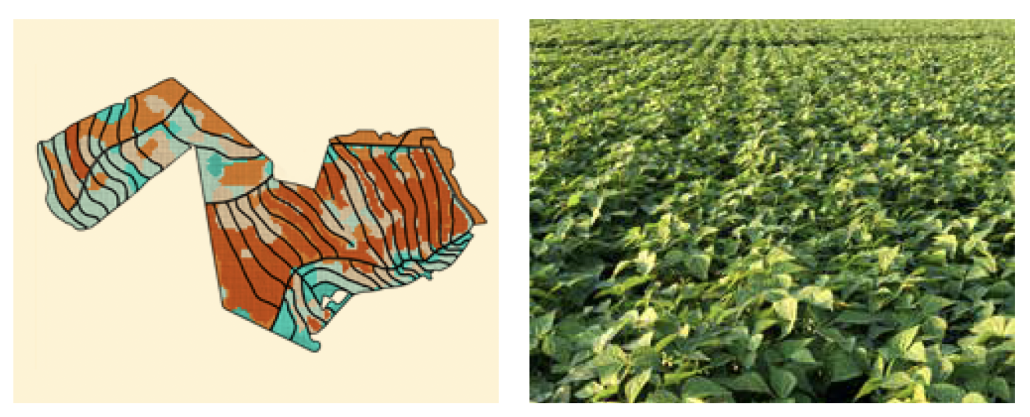
During the data analysis process, the main yield-affecting drivers inside the soil are identified. Variable rate maps are then created according to these main drivers. For example, where a field consists mainly of Avalon soil types, but numerous high- and low-yielding areas are present in the soil type, the existence of these areas is often linked to secondary or tertiary soil factors that induce such variability. These factors may be one of many possible drivers such as water-table depth, severity of waterlogging, texture etc. These drivers are easily identified when looking at big data. If the driver can be easily fixed, then an action plan is put together to target and correct it. If the driver cannot be fixed and forms part of the inherent qualities of the soil, then a great opportunity exists to apply fertiliser and seed at variable rates, according to the variables identified. >>

Case study
A real-world example of a variable rate application (VRA) exercise performed over a 5-year period is discussed below. The farm is typically planted under yellow maize and soya beans. A crop rotation system of maize-on-maize back to soya beans is followed. Based on equipment constraints, only fertiliser was historically applied at a variable rate, but in the past 2 seasons variable rate seeding was also implemented. Only maize was planted with variable rate fertiliser and seed. The farm’s total hectares were rounded down to 1 000 ha, for ease of comparison. Historically, the average application of fertiliser on the farm was 250 kg/ha. It was therefore decided to split the applications into four categories with differing rates as follows: (1) the worst soils at 200 kg/ha, (2) soils slightly below average at 225 kg/ha, (3) soils above average at 275 kg/ha and (4) the best soils at 300 kg/ha. The purpose of this strategy was to manage and spread the risk as the farm is divided into different rainfall regions. Some areas receive consistently good rain throughout the season (on average) and others are exposed to more inconsistent rain.
Results (ROI)
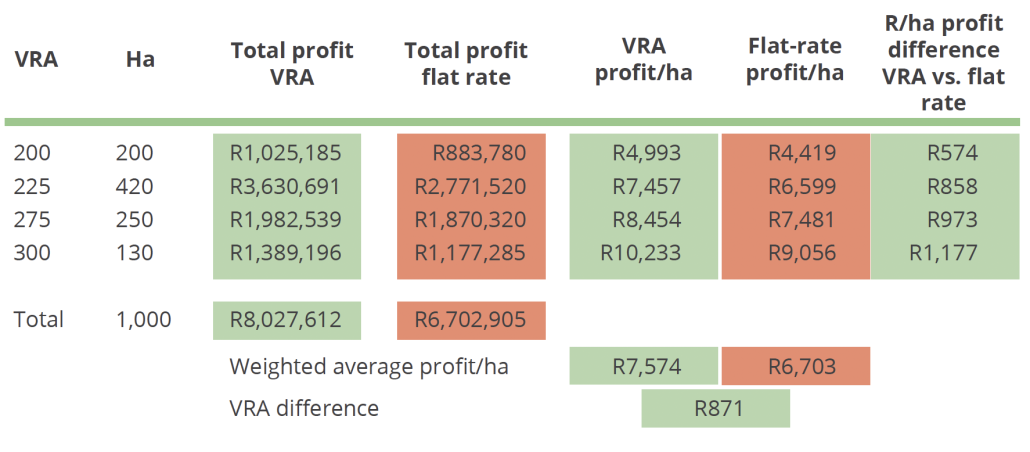
The results achieved are set out in table format (Table 1). Each rate category is provided in the far left column, followed by the total amount of hectares represented by each category. The total profit for each category is provided for the variable rate applied fields, as well as a simulated profit, had those fields been planted at 250 kg/ha flat rate. The financial data is the average for a 5-year period. Financial results have been adjusted for inflation and input cost variation experienced over those 5 years. It must be noted that this is not a perfect comparison, as the yieldresponse between a VRA field and a flat rate field cannot be measured here. These results are driven only by actual yield and input cost (VRA), compared to actual yield and virtual input cost (at 250 kg/ha).
Financial results
The cells highlighted in green represent the winning category while those in orange indicate the losing category. It is interesting to note that the higher rate areas, representing approximately 40% of the farm, achieved the highest difference in profit on average. This trend of course differs between rainfall regions and soil characteristics, but the trends are always there – highlighting the massive potential financial gains by implementing relatively small changes. Attention should be drawn to the overall weighted average profit/ha (Table 1). These averages are weighted in terms of the hectare distribution of the different categories. Ultimately, the VRA beats the flat rate simulation by R871/ha, which, within only one year, more than pays for the soil classification service performed. Seeing as the soil classification service is a once-off service to be used for decades to come, this is an excellent ROI.
Table 1: Summary of the financial results of applying fertiliser at variable rates (rates given in leftmost column) according to dominant soil physical and chemical features. VRA results are compared to simulated flat-rate applications. These features were analysed and identified using the Agri Technovation MY DATA MINING™ service.

Combined soil and yield data for optimum results
Agri Technovation creates a link between soil-physical, -chemical and yield data by combining MYSOIL CLASSIFICATION™ and ITEST™SOIL obtained data with yield maps through the MYDATA MINING™ service.
What is required for the MYDATA MININGTM service?
- Soil classification data
- Precision soil chemical data; and
- Yield maps.
Why is data mining so powerful?
- Agronomic factors drive plant production such as soil-physical and -chemical (fertility) factors.
- The power therein is to analyse large data sets with the push of a button.
- It is used to understand where and what limiting layers have the most influence on production.
- An action plan is assembled to reduce or manage the limiting factors.
- Input costs are managed optimally – long-term data suggests a saving of 16%.
- Through this production potential is improved and/or profit margins are increased.
- Combined with the soil services, it presents a very favourable ROI.


